Rightware has released Kanzi Monitor 1.40.0 — a Kanzi Engine plugin that transforms how development teams profile, debug, and inspect running Kanzi applications. From real-time frame analysis and remote scene graph introspection to browser-based diagnostic UIs and an AI-native MCP server that connects Claude directly to your running application, Kanzi Monitor brings professional-grade observability tooling to every phase of development and validation.
Whether you are chasing a frame rate drop on a QNX instrument cluster, inspecting a broken binding on an Android target, or running an AI-assisted debug session from Claude Code, Kanzi Monitor gives you the visibility you need — without recompiling, without guessing, and without leaving your tools.
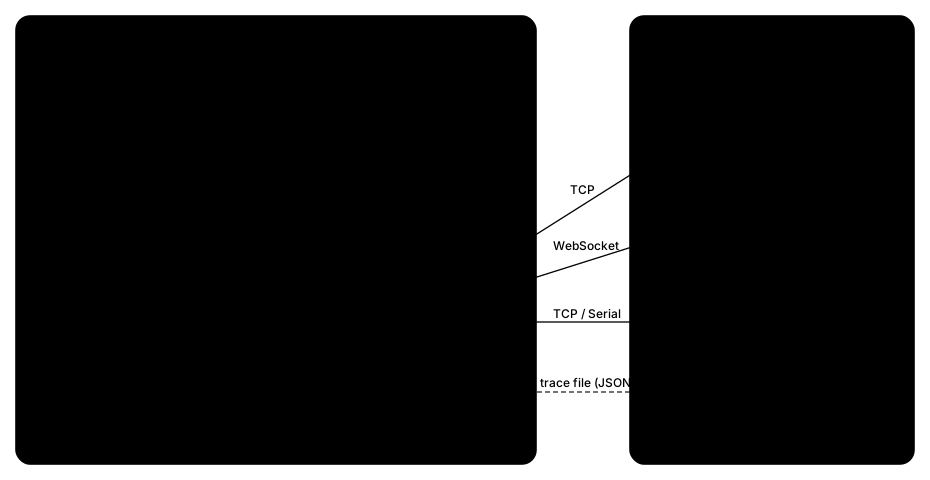
Kanzi Monitor is a Kanzi Engine plugin distributed as a separate package from Kanzi Hub. Once integrated into your application project, it activates a suite of independently configurable diagnostic services that run alongside your application at runtime. These services expose the application's internals over TCP and serial (UART) connections, through a browser-based Web UI, and — new in 1.40 — through an MCP server that AI assistants can query directly.
Kanzi Monitor supports all major Kanzi platforms: Windows, Linux, Android, QNX, and INTEGRITY. It integrates into both the C++ appfw application framework and the Android droidfw framework with Java bindings.
Kanzi Monitor's capabilities are organized into eight discrete services. Each service addresses a specific diagnostic task and can be enabled or disabled independently in kanzimonitor.cfg. You never pay the runtime cost of a service you are not using.
Your Kanzi Application
        │
        └── Kanzi Monitor Plugin
              ├── Profiling Trace Service   → Perfetto-compatible trace files
              ├── Command Processor Service → TCP / Serial CLI
              ├── UI Service                → On-screen diagnostic overlays
              ├── Log Service               → In-memory ring buffer log
              ├── Performance Service       → FPS, frame timing, GPU stats
              ├── Overwatch Service         → JSON scene graph introspection
              ├── Monitor Web UI            → Browser-based debug GUI
              └── MCP Server                → AI assistant integration
Collects runtime profiling data from the Kanzi Engine and writes it to a JSON trace file compatible with the Perfetto trace viewer. Every frame, every rendering stage, every engine operation is timestamped and recorded. Open the trace in Perfetto and see exactly where your frame budget is being spent — down to the individual render pass.
For Debug and Profiling build configurations, the Profiling Trace service also captures kzTrace — Kanzi's engine-native tracing instrumentation — alongside the standard Monitor trace, giving an even more granular view of engine internals.
Full details: Using the Profiling Trace service
Provides a command-line interface for interacting with the Kanzi Engine at runtime. Commands can be issued through a local terminal, a remote TCP connection, or a serial port (UART). The RemoteConsoleClient and SerialConsoleClient tools, both included in the Kanzi Monitor package, make it straightforward to connect from a development workstation to a target device over the network or a physical serial link.
The Command Processor is the transport layer underpinning both the Overwatch service and the MCP server — every overwatch.* query ultimately passes through it.
Full details: Using the Command Processor service
Renders graphical overlays on top of the running application to display diagnostic information in-context. Other services register their own overlay screens through the UI service — the Log service, for example, can surface log output directly on screen — and the full set of available BasicUI screens can be cycled at runtime without modifying the application binary.
Full details: Using the UI service
Captures Kanzi Engine log messages into an in-memory ring buffer that survives across frames. Log entries are viewable through the console, through the on-screen overlay, and embedded in profiling traces — so you can correlate a log message with the exact frame in which it occurred. No more scrolling past thousands of console lines trying to find the one message that mattered.
Full details: Using the Log service
Continuously measures and exposes runtime performance metrics: frame rate, frame timing, rendering statistics, GPU object counts, and staging buffer usage. Metrics are exported as counter tracks in the Perfetto trace viewer, so performance data and profiling timeline data can be analyzed together in a single view. Performance watchers can also be configured to trigger commands automatically when a metric crosses a defined threshold — enabling automated regression detection without manual monitoring.
Full details: Using the Performance service
The heart of Kanzi Monitor's runtime inspection capability. The Overwatch service provides JSON-based remote introspection of a running Kanzi application through a set of overwatch.* commands. It exposes:
The Overwatch service is what powers both the Monitor Web UI and the MCP server. Everything those tools can see and do flows through Overwatch.
Full details: Using the Overwatch service
The Monitor Web UI is a browser-based graphical interface for remote inspection and debugging that requires no additional software beyond a web browser. It connects to the Overwatch service through a Python WebSocket bridge and provides:
The Monitor Web UI closes the gap for team members who need runtime inspection capabilities but do not want to work in a terminal. QA engineers, technical artists, and project leads can connect a browser to a running device and inspect the application state without any command-line tooling.
Full details: Using the Monitor Web UI
The most significant new capability in Kanzi Monitor 1.40.0.
The Kanzi Monitor MCP server is a Python tool bundled in tools/monitor-mcp-server/ that exposes every Overwatch command as a structured tool for AI assistants — specifically Claude Code and Claude Desktop. Once connected, your AI assistant can inspect and interact with a live, running Kanzi application in real time, through natural language requests.
The architecture is straightforward:
Claude Code / Claude Desktop
        │ (stdio — Model Context Protocol)
        ▼
   MCP Server (Python)
        │ (TCP port 56000, or Serial / UART)
        ▼
  Kanzi Monitor Console
        │
        ▼
  Your Running Kanzi Application
The MCP server runs as a subprocess of the AI assistant. It receives tool calls over standard I/O, forwards them as overwatch.* commands over TCP or serial to the running application, and returns structured JSON responses back to the assistant. Large responses — scene graphs, texture images, profiling traces — are automatically written to temporary files rather than flooding the assistant's context window.
| Category | Tools |
|---|---|
| Scene Graph | get_scene_tree, get_node_properties, set_node_property |
| Resources | get_resources, get_all_resources, get_resource_info, purge_resources |
| Rendering | get_framebuffers, get_render_passes, get_render_pass_preview, get_texture_preview, take_screenshot, get_graphics_info |
| Performance | get_performance, get_app_performance, get_performance_info_level, set_performance_info_level, list_watchers, add_watcher, remove_watcher, reset_watcher, clear_watchers |
| Profiling | capture_trace, fetch_trace, capture_kztrace, fetch_kztrace |
| Data Sources | get_data_sources, set_data_value |
| Logging | get_logs, get_log_diagnostics |
| UI Overlays | get_ui_visibility, toggle_ui, get_basicui_screens, set_basicui_screen, get_font_scale, set_font_scale |
| Application | get_status, get_idle_suspend, set_idle_suspend, send_command, quit_application |
Create a .mcp.json file in the root of your Kanzi application project:
{
  "mcpServers": {
    "kanzi-monitor": {
      "command": "python",
      "args": ["../../Engine/plugins/monitor/tools/monitor-mcp-server/kanzi_monitor_mcp.py"],
      "env": {
        "KANZI_MONITOR_HOST": "127.0.0.1",
        "KANZI_MONITOR_PORT": "56000"
      }
    }
  }
}
Add the following to your claude_desktop_config.json:
{
  "mcpServers": {
    "kanzi-monitor": {
      "command": "python",
      "args": ["C:/KanziWorkspace/Engine/plugins/monitor/tools/monitor-mcp-server/kanzi_monitor_mcp.py"],
      "env": {
        "KANZI_MONITOR_HOST": "127.0.0.1",
        "KANZI_MONITOR_PORT": "56000"
      }
    }
  }
}
For embedded targets without a network connection, the MCP server supports serial (UART) transport. Set KANZI_MONITOR_SERIAL_PORT to connect:
"env": {
  "KANZI_MONITOR_SERIAL_PORT": "COM3",
  "KANZI_MONITOR_BAUD_RATE": "115200"
}
Full details: Using the Kanzi Monitor MCP server
"The cluster is dropping below 60 fps in the navigation view. What's taking so long?" →
capture_trace→fetch_trace→ AI analyzes frame timing breakdown, identifies the expensive render pass, suggests which node's composition settings to investigate →get_render_pass_preview→ visual confirmation of the suspect pass output
"The speedometer needle is not rotating correctly on the device." →
get_scene_tree→ find the needle node →get_node_properties→ inspect current rotation value and binding state →set_node_property→ test a corrected value live on device, no redeploy
"The application is using more VRAM than expected. What is loaded?" →
get_resources→ full inventory of loaded resources with memory usage per resource →get_all_resources→ compare loaded vs. unloaded to spot resources that should have been purged →purge_resources→ release unused resources and confirm the reclaim
"There is a visual artifact in the rearview camera inset. Is the render target correct?" →
get_framebuffers→ list all FBO-backed render targets →get_render_pass_preview→ get a PNG image of the render target's current contents directly in the AI session
"The fuel level gauge is not updating. Is the data source receiving values?" →
get_data_sources→ inspect the full DataObject tree and current values →set_data_value→ inject a test value and confirm the binding propagates
| Feature | Detail |
|---|---|
| Distribution | Plugin package from Kanzi Hub, installs to Engine/plugins/monitor/ |
| Integration | CMake-based; prebuilt libraries or source integration |
| Transport | TCP (default port 56000) and Serial / UART |
| Trace format | Perfetto-compatible JSON; kzTrace for Debug/Profiling builds |
| Web UI | Browser-based, Python WebSocket bridge, no client install |
| MCP server | Python, stdio transport, 42 structured tools |
| AI clients | Claude Code, Claude Desktop, any MCP-compatible assistant |
| Platform support | Windows, Linux, Android, QNX, INTEGRITY |
| Language bindings | C++ (appfw), Java (droidfw) |
| Services | 8 independently configurable services |
Download Kanzi Monitor from Kanzi Hub under Feature Packs, selecting your Kanzi Studio version and target platform. Extract to <KanziWorkspace>/Engine/plugins/monitor/ and follow the integration guide for your build system.
Full documentation, integration guides, and service references are available at:
Kanzi Monitor 1.40.0 is available now from Kanzi Hub. It is distributed as a standalone plugin package independent of the main Kanzi release cycle, and is compatible with the equivalent release of Kanzi and the platforms it supports.
Kanzi Monitor 1.40.0 — docs.kanzi.com/monitor/1.40.0
